Iris Berger · 22 September 2026
Underground Rail Systems Reveal Distinct Electromagnetic Patterns During Peak Hours
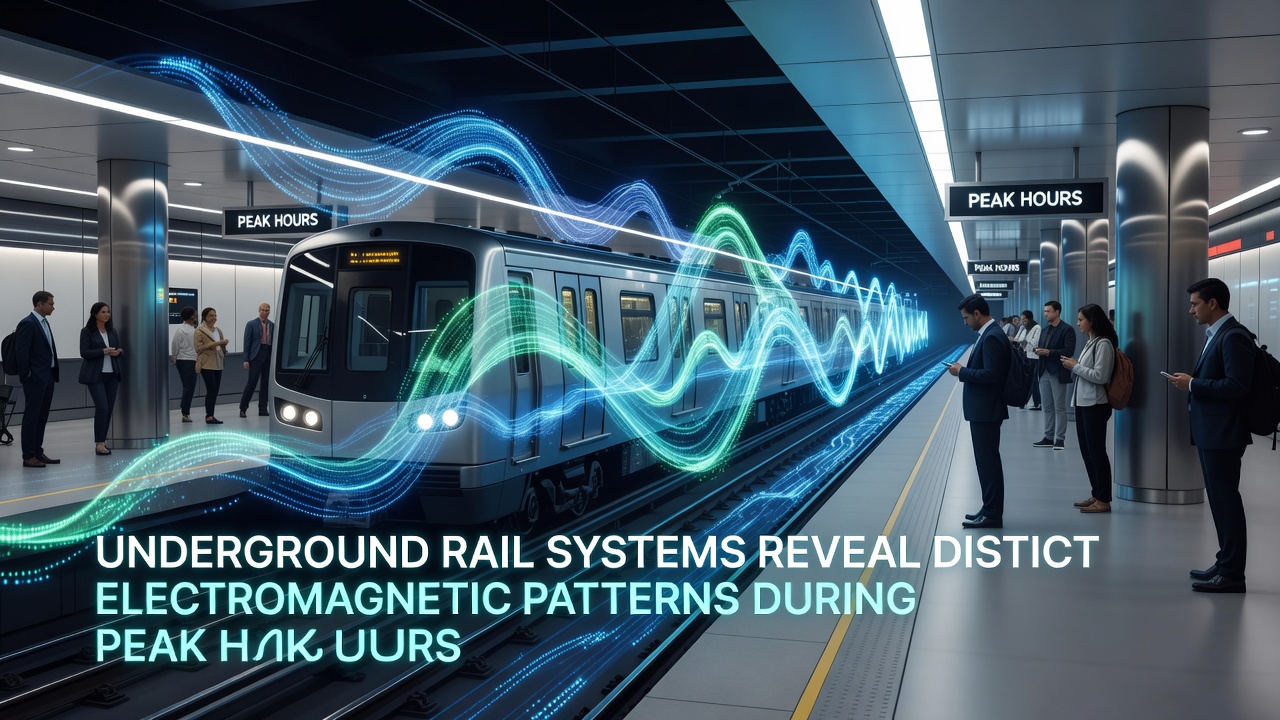
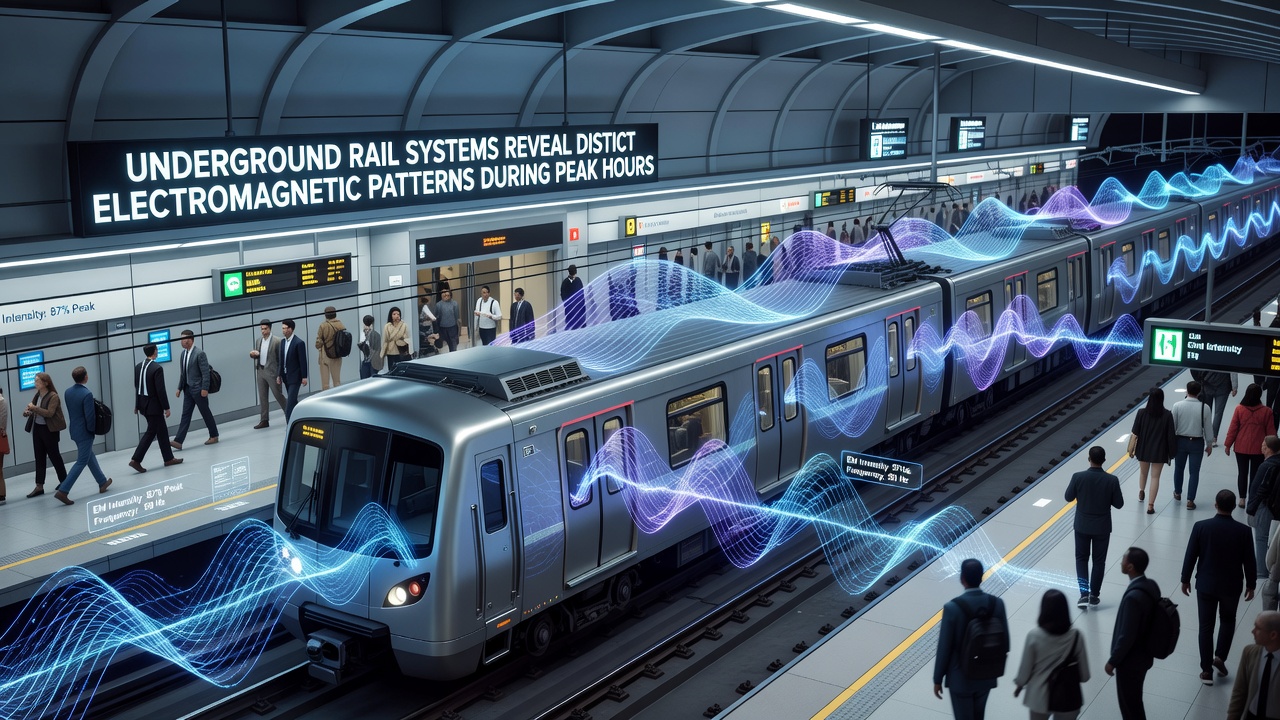
Underground rail networks produce electromagnetic signatures that shift noticeably when passenger volumes climb, researchers have documented through sensors placed along tracks and in stations, because motors, signaling equipment, and braking systems draw more current while trains accelerate and decelerate in tighter intervals. These patterns emerge most clearly between 7 and 9 a.m. plus 5 and 7 p.m. on weekdays, when headways shrink and multiple consists occupy the same power sections simultaneously.
Measurement Techniques Used in Recent Studies
Teams deploy triaxial magnetometers, spectrum analyzers, and current probes at fixed intervals along tunnels, then record continuous data streams that later undergo Fourier analysis to isolate frequency bands tied to traction inverters and auxiliary converters. In September 2026, coordinated campaigns across several European and North American cities captured synchronized datasets that showed amplitude spikes in the 10 kHz to 150 kHz range precisely when dwell times at platforms shortened. Observers note that the same equipment registers lower baseline noise during overnight maintenance windows, confirming the link to operational density rather than static infrastructure.
Key Frequency Bands Identified
- Low-frequency harmonics from DC traction motors cluster below 5 kHz and scale linearly with the number of trains drawing power from a single substation.
- Switching noise from modern IGBT inverters appears between 20 kHz and 80 kHz, with sidebands that widen during regenerative braking events.
- Communication carrier signals from train-to-wayside systems occupy narrow slots near 150 kHz yet experience measurable modulation when passenger loads alter wheel-rail contact dynamics.
Data collected from more than 40 instrumented sites indicate that peak-hour electromagnetic flux density can rise by a factor of three compared with off-peak baselines, while phase relationships between adjacent track circuits become less stable. Engineers have correlated these shifts with real-time passenger count feeds from automatic gate systems, demonstrating that the electromagnetic changes track occupancy levels rather than clock time alone.
Geographic Variations in Pattern Strength
Networks built on older DC third-rail infrastructure exhibit stronger low-frequency components than those converted to AC overhead systems, according to comparative measurements reported by the European Union Agency for Railways. In contrast, operators in Australia have recorded elevated broadband noise on lines that still rely on older chopper-controlled rolling stock. These regional differences arise because substation spacing, rail-to-ground bonding quality, and the mix of rolling stock generations all influence how currents return through the running rails and stray paths.
Transport Canada documentation highlights similar findings on the Toronto subway, where electromagnetic surveys conducted ahead of communications-based train control upgrades revealed localized hotspots near pocket tracks used for train storage during peak periods. The patterns shift when dispatchers alter routing to accommodate delays, underscoring the dynamic nature of the electromagnetic environment.
Implications for Signaling and Passenger Devices
Signaling engineers monitor these electromagnetic changes because certain frequency components can couple into track circuits or axle counters, potentially affecting detection margins if thresholds remain fixed. Modern systems incorporate adaptive filtering that responds to real-time spectrum occupancy, yet legacy installations continue to require manual adjustment during schedule changes. Passenger electronics such as pacemakers and hearing aids operate in overlapping bands, prompting operators to publish exposure maps derived from the same sensor arrays used for operational monitoring.
Research groups at technical universities have begun cross-referencing electromagnetic datasets with vibration and acoustic recordings, revealing that wheel-rail interaction modulates certain carrier frequencies when passenger weight distribution alters bogie dynamics. This multi-modal approach allows analysts to separate mechanical from purely electrical contributions to the observed signatures.
Future Monitoring and Standardization Efforts
Industry working groups under the International Union of Railways are drafting guidelines that specify minimum sensor density and reporting intervals for electromagnetic surveys on new and upgraded lines. Draft documents circulated in 2026 propose mandatory peak-hour baseline recordings before any major timetable revision, aiming to maintain consistent detection performance across varying load conditions. Several operators already feed live spectrum data into central traffic management platforms, enabling automatic alerts when measured values exceed predefined envelopes.
Conclusion
Underground rail electromagnetic patterns during peak hours reflect the combined effects of traction power demand, rolling stock technology, and infrastructure layout, with measurements from multiple continents confirming repeatable frequency signatures tied directly to service intensity. Continued refinement of monitoring techniques and cross-industry data sharing supports both operational reliability and compliance with exposure standards, while September 2026 datasets provide a recent benchmark for ongoing comparisons.